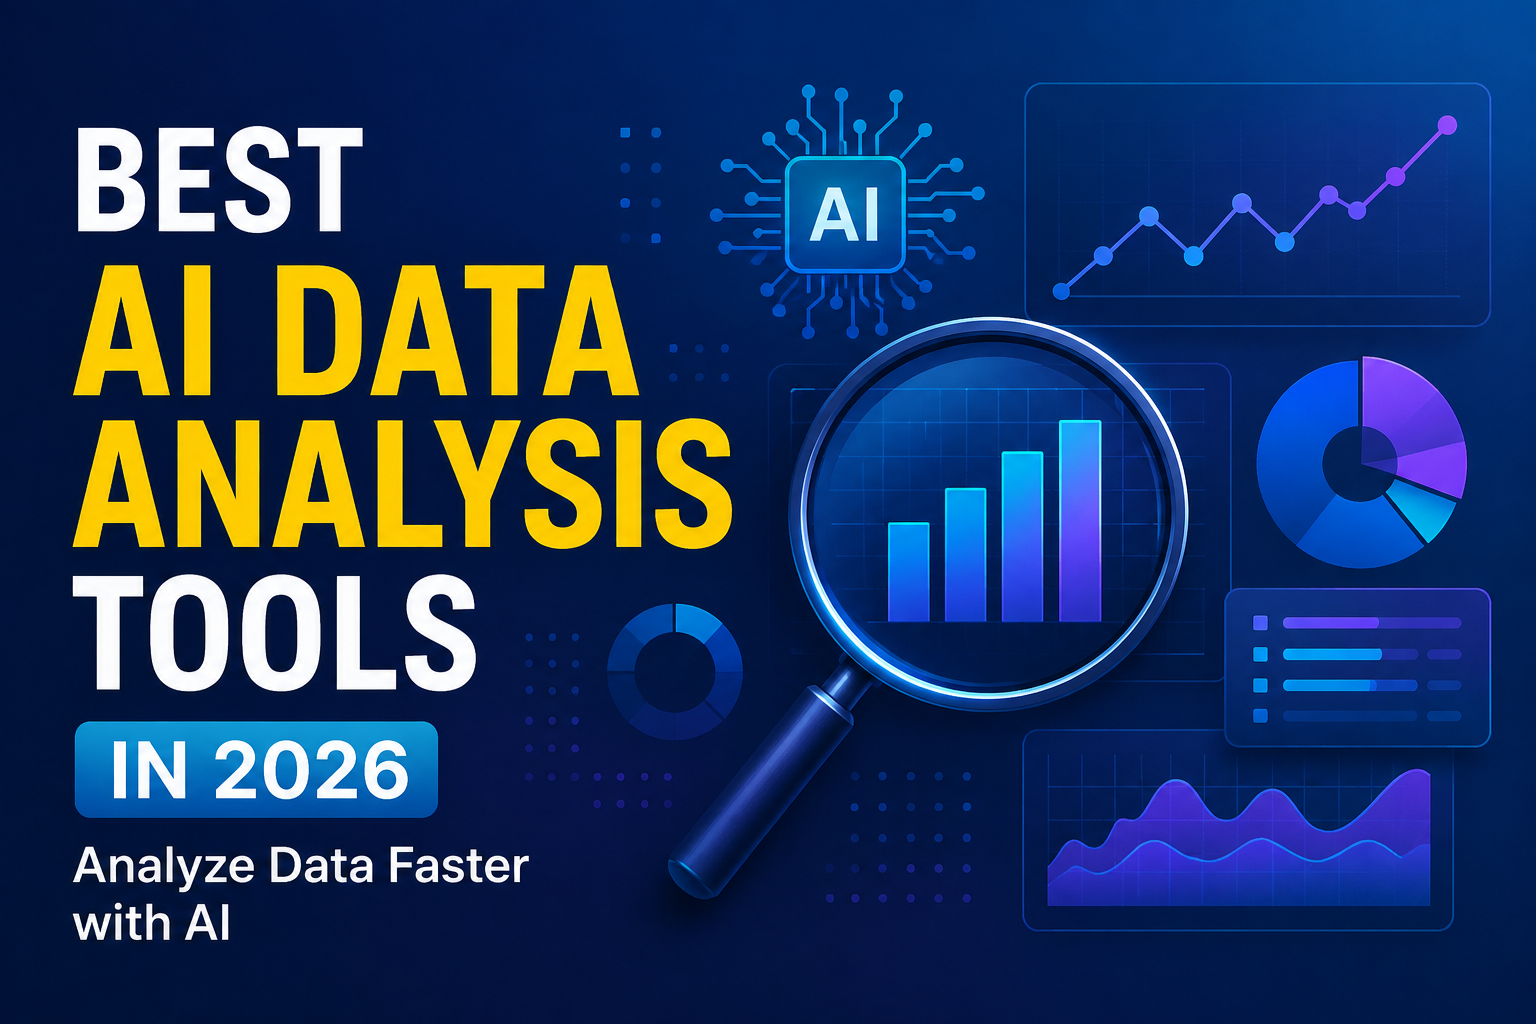
Best AI Data Analysis Tools in 2026: 5 Tools for Smarter Data Insights
September 2026
Analyzing data used to require a combination of spreadsheets, SQL, statistics, dashboards, and specialized analytics software. Today, AI data analysis tools can automate many of these tasks and let users explore datasets through natural-language questions.
Instead of manually searching through thousands of rows, users can ask questions such as:
- Which products generated the most revenue?
- What changed compared with last month?
- Which marketing channel has the highest return?
- Are there unusual patterns in this dataset?
- Can you create a chart showing sales by region?
Depending on the platform, AI can help clean and transform data, generate charts, explain trends, write formulas or code, summarize reports, and support statistical analysis.
However, not every AI analytics tool is designed for the same job. Power BI and Tableau are primarily business intelligence platforms, ChatGPT is particularly flexible for conversational spreadsheet and file analysis, Julius AI focuses heavily on AI-assisted analysis and statistics, while Looker Studio is especially useful for dashboards and marketing reporting.
This guide compares five leading options and explains which type of user each one suits best.
Important: Features, availability, pricing, and AI capabilities can change frequently. Always check the provider’s current documentation before purchasing a plan or uploading sensitive information.
Quick Comparison
| Tool | Best for | Free option | Main strength |
|---|---|---|---|
| Microsoft Power BI Copilot | Business intelligence | Limited/free options vary | Enterprise analytics and AI-assisted reporting |
| Tableau AI | Advanced dashboards | Trial/options vary | Visualization and governed analytics |
| ChatGPT | Spreadsheet and file analysis | Free + paid plans | Natural-language data exploration |
| Julius AI | Statistical and advanced analysis | Free plan | Code-backed analysis and visualization |
| Google Looker Studio | Marketing reporting | Free | Accessible dashboards and Google integrations |
Which AI data analysis tool should you choose?
- Best for enterprise BI: Microsoft Power BI Copilot
- Best for advanced visualization: Tableau AI
- Best for conversational spreadsheet analysis: ChatGPT
- Best for statistical analysis: Julius AI
- Best free reporting platform: Google Looker Studio
1. Microsoft Power BI Copilot — Best for Business Intelligence
Microsoft Power BI is a full business intelligence platform rather than simply an AI chatbot. Its Copilot features add natural-language assistance to workflows involving reports, semantic models, dashboards, and data analysis.
Microsoft’s current documentation describes Copilot in Power BI as providing chat-based experiences for tasks ranging from on-the-fly analysis to DAX generation. Users can interact with their data using natural language and receive summaries, insights, and visual responses.
Why Power BI Copilot stands out
The biggest advantage of Power BI is its combination of AI assistance and established business intelligence infrastructure.
For example, a business analyst can work with a Power BI report and ask Copilot to summarize performance or identify important changes. Microsoft also documents experiences where Copilot generates summaries together with references to report visuals.
This makes Power BI particularly suitable when AI analysis needs to fit into an existing reporting environment rather than operate as a standalone chatbot.
Key features
- Natural-language questions about data
- AI-assisted report summaries
- AI-assisted visual exploration
- DAX assistance
- Interactive dashboards
- Business intelligence reporting
- Data modeling
- Microsoft ecosystem integration
- Enterprise-oriented administration and governance
- Mobile experiences for supported Copilot features
Strengths
- Excellent for business intelligence workflows
- Strong dashboard and reporting capabilities
- Useful for organizations already using Microsoft products
- Supports both business users and more technical analysts
- AI can assist with report creation and analysis
Limitations
- More complex than a simple spreadsheet chatbot
- Copilot availability depends on the relevant Power BI/Fabric environment, licensing, and configuration
- Beginners may need time to understand data models and Power BI concepts
- Some advanced functionality is designed primarily for organizational environments
Best for
Power BI Copilot is a strong choice for:
- Business analysts
- Finance teams
- Sales departments
- Marketing teams
- Enterprise organizations
- Data professionals
- Companies already invested in Microsoft technologies
Our assessment
Choose Power BI Copilot when your goal is to combine AI-assisted analysis with a serious business intelligence and reporting workflow.
2. Tableau AI — Best for Data Visualization and Dashboards
Tableau has long been known for interactive data visualization. Its newer AI capabilities add natural-language assistance and automated insight discovery to that foundation.
Tableau’s current AI documentation describes Tableau Agent as a conversational assistant that can help users explore data, create visualizations, and work with calculations. Tableau Pulse provides another layer focused on metrics, trends, contributors, and insights.
What makes Tableau different?
Tableau’s strength is not simply asking an AI a question about a spreadsheet. The platform is designed around visual analytics and governed business metrics.
For example, Tableau Pulse can surface changes in metrics and help users investigate why those changes occurred. Tableau Agent in Pulse can examine groups of metrics and return insights with supporting visualizations and source references.
That makes Tableau particularly interesting for teams where dashboards and recurring business metrics are central to decision-making.
Key features
- Interactive data visualization
- Tableau Agent
- Tableau Pulse
- Natural-language analysis
- Automated insight discovery
- Dashboard creation
- Metric monitoring
- Business intelligence workflows
- Data exploration
- AI-assisted calculations and visualization
Strengths
- Excellent visualization capabilities
- Strong dashboard ecosystem
- Useful for recurring business metrics
- AI features are integrated into analytics workflows
- Suitable for professional BI teams
Limitations
- More complex than lightweight AI spreadsheet tools
- Pricing and AI availability depend on the Tableau environment and license
- Some advanced AI functionality is associated with Tableau+ or specific configurations
- Beginners may need time to learn the platform
For example, Tableau currently documents Tableau Agent in Pulse as a Tableau+ feature, while also providing a limited trial mechanism for eligible Tableau Cloud sites.
Best for
Tableau AI is particularly suitable for:
- Data analysts
- Business intelligence teams
- Executives
- Marketing departments
- Financial teams
- Organizations that rely heavily on dashboards
- Companies that need governed metrics and visualization
Our assessment
Choose Tableau when visualization, dashboards, and structured business metrics are more important than simply uploading a spreadsheet and asking questions.
3. ChatGPT — Best for Conversational Spreadsheet Analysis
OpenAI ChatGPT is one of the most flexible options for people who want to analyze files using natural language.
According to OpenAI’s current documentation, ChatGPT can analyze uploaded spreadsheets and other supported files, create tables and charts, and perform code-backed analysis. Supported formats include common spreadsheet files such as XLSX and CSV, although availability can vary by model, plan, workspace, and account configuration.
Why ChatGPT is useful for data analysis
The main advantage is simplicity.
A user doesn’t necessarily need to know SQL or Python before starting an analysis. They can upload a structured dataset and explain what they want to understand.
For example:
“Analyze monthly sales and identify the three products with the largest year-over-year growth.”
Or:
“Create a chart comparing revenue by region and explain the biggest differences.”
ChatGPT can then inspect the uploaded data and produce tables, charts, explanations, or further analysis.
What ChatGPT can help with
- Excel analysis
- CSV analysis
- Data summaries
- Trend identification
- Data cleaning
- Charts and tables
- Statistical calculations
- Code-assisted analysis
- Spreadsheet questions
- Report generation
- Exploratory analysis
Strengths
- Very accessible
- Natural-language interface
- Flexible across many types of tasks
- Useful for both simple and moderately complex analysis
- Can explain analytical results in plain English
Limitations
- It is not a replacement for a full enterprise BI platform
- Visualization and dashboard workflows differ from dedicated BI products
- Results should be checked before being used for important decisions
- File and data-analysis capabilities vary by plan and environment
Best for
ChatGPT is a strong option for:
- Students
- Freelancers
- Researchers
- Marketers
- Small business owners
- Consultants
- Analysts
- Anyone who wants to explore spreadsheets conversationally
Our assessment
Choose ChatGPT if you want the easiest way to ask questions about spreadsheets and structured data without building a complete BI environment.
4. Julius AI — Best for Statistical and Advanced Data Analysis
Julius AI is designed specifically around AI-assisted analysis. Its current platform supports data visualization, data preparation, statistical analysis, forecasting, and code-backed workflows.
Unlike a general-purpose chatbot, Julius positions itself as an AI workspace where users can bring spreadsheets, documents, or connected data sources and then perform analysis through natural-language instructions.
Why Julius AI is interesting
One of Julius’s strongest differentiators is the connection between conversational analysis and underlying analytical code.
Its documentation says users can ask natural-language questions while Julius generates the code required for the analysis. It can also show the underlying code behind insights, helping users inspect how conclusions were produced.
Julius also supports workflows involving statistical analysis, including regression and other analytical methods, as well as data cleaning and visualization.
Key features
- Natural-language data analysis
- Data cleaning
- Charts and visualizations
- Statistical analysis
- Regression analysis
- Forecasting
- Code-backed analysis
- Spreadsheet analysis
- Connected data sources
- Report generation
- Data-driven presentations
Current pricing structure
Julius currently offers a free tier, with paid plans adding more credits and advanced capabilities. Its published pricing currently lists Plus at $20/month, Pro at $45/month, and higher plans for heavier or team usage, with annual billing discounts shown on the pricing page.
Because AI pricing changes frequently, check the official pricing page before publishing exact prices in a permanent article.
Strengths
- Strong focus on data analysis
- Useful statistical workflows
- Natural-language interaction
- Can expose underlying analytical code
- Good visualization capabilities
- Supports connected data for higher-tier workflows
Limitations
- Credit limits can affect usage
- Advanced features may require paid plans
- More specialized than a general-purpose AI assistant
- Business and enterprise features vary by plan
Best for
Julius AI is particularly useful for:
- Researchers
- Students
- Data analysts
- Statisticians
- Business analysts
- Marketing analysts
- Professionals who want code-backed analysis without writing the code themselves
Our assessment
Choose Julius when statistical analysis, visualization, and deeper analytical workflows are more important than simple spreadsheet questions.
5. Google Looker Studio — Best for Free Marketing Dashboards
Google Looker Studio is different from the other tools in this comparison.
It is primarily a reporting and visualization platform, rather than a general-purpose AI data analyst. That distinction is important.
Google describes the no-cost version as a tool for creating customizable reports with a drag-and-drop editor. Its documentation says it supports self-service analytics, interactive dashboards, and access to more than 1,000 data sources.
Why marketers use Looker Studio
Looker Studio is particularly useful when your data already lives in the Google ecosystem.
A marketing team can build dashboards that bring together information from different sources and present KPIs in one report.
Typical use cases include:
- Website performance
- SEO reporting
- Advertising performance
- Search performance
- Ecommerce reporting
- Client dashboards
- Campaign reporting
Key features
- Interactive dashboards
- Drag-and-drop reports
- Data visualization
- Multiple data sources
- Shareable reports
- Embedding options
- Marketing reporting workflows
- Google ecosystem integrations
Strengths
- No-cost version available
- Easy to share reports
- Strong choice for marketing dashboards
- Flexible visualization
- Large number of available data sources
Limitations
- It is primarily a reporting and visualization platform
- It does not offer the same conversational AI analysis experience as ChatGPT or Julius
- Advanced enterprise capabilities may require paid features
- Some third-party connectors can involve additional costs
Best for
Looker Studio is especially useful for:
- SEO professionals
- PPC specialists
- Digital marketers
- Marketing agencies
- Website owners
- Ecommerce businesses
- Small businesses
- Freelancers creating client reports
Our assessment
Choose Looker Studio when your priority is building shareable dashboards and marketing reports rather than performing deep statistical analysis through conversational AI.
AI Data Analysis Tools vs Traditional Analytics Software
AI doesn’t necessarily replace traditional analytics software. In many cases, the most effective workflow combines the two.
A traditional BI platform may provide:
- Data modeling
- Dashboards
- Permissions
- Scheduled reporting
- Governance
- Data connectors
An AI layer can make those capabilities easier to use by allowing people to ask questions in natural language or automate parts of the analytical workflow.
This is why platforms such as Power BI and Tableau are interesting: their AI features are integrated into broader analytics ecosystems rather than existing independently.
For individual spreadsheet analysis, however, a conversational tool such as ChatGPT or Julius may be much faster to start with.
How We Evaluated These AI Data Analysis Tools
Rather than assigning arbitrary star ratings, this comparison evaluates each platform using practical criteria.
1. Analysis capabilities
Can the tool help users move beyond simple summaries and investigate trends, relationships, or patterns?
2. Ease of use
Can someone with limited technical knowledge start analyzing data without spending weeks learning the platform?
3. Visualization
Does the tool produce useful charts, dashboards, or other visual representations?
4. Data compatibility
What types of files, databases, connectors, or data sources can the platform work with?
5. Depth
Is the platform suitable for basic spreadsheet questions, advanced statistical analysis, or enterprise BI?
6. Transparency
Does the platform provide explanations, references, underlying calculations, or other ways to inspect analytical results?
7. Workflow fit
Does the tool match the way the intended user actually works?
This last factor is important because the most powerful AI data analysis tool isn’t automatically the best tool for every user.
How to Choose the Best AI Data Analysis Tool
Start with Your Data
First determine what you actually need to analyze.
For example:
- Excel spreadsheets
- CSV files
- Marketing reports
- Financial information
- Customer data
- Website analytics
- Sales data
- Research datasets
- Business intelligence metrics
A simple spreadsheet workflow doesn’t necessarily require enterprise BI software.
Decide How Much Technical Control You Need
If you want to ask questions in plain English, ChatGPT or Julius may provide a simpler starting point.
If you need governed dashboards, semantic models, permissions, and organization-wide reporting, Power BI or Tableau may be more appropriate.
Consider Visualization
If your main goal is presenting information visually, prioritize tools with strong dashboard capabilities.
Tableau is particularly focused on visualization, while Power BI combines dashboards with broader business intelligence functionality.
For marketing reports, Looker Studio can be a practical low-cost option.
Look at Integrations
Your ideal tool should work with the systems you already use.
Before choosing a platform, check whether it supports the relevant:
- Spreadsheets
- Databases
- CRM systems
- Advertising platforms
- Analytics platforms
- Cloud services
- Data warehouses
Consider Your Budget
Free or lower-cost tools can be enough for individual analysis.
Businesses with larger datasets, multiple users, governance requirements, or advanced integrations may need paid plans.
Don’t choose a platform solely because it has the largest feature list. Choose one that provides the capabilities your workflow actually requires.
How to Get Better Results from AI Data Analysis
AI can accelerate analysis, but the quality of the input still matters.
Clean Your Dataset
Before asking an AI system to analyze your data, check for:
- Duplicate records
- Missing values
- Incorrect column names
- Inconsistent date formats
- Incorrect categories
- Duplicate transactions
- Unexpected outliers
Poor data can produce misleading conclusions regardless of how sophisticated the AI system is.
Ask Specific Questions
Instead of:
“Analyze this data.”
Try:
“Compare monthly revenue by region and identify the regions with the fastest year-over-year growth.”
Specific questions give the analytical system a clearer objective.
Explain the Business Context
The same number can mean different things in different situations.
For example, a 20% decline in sales could be concerning, but it may be expected if the business is seasonal.
Giving the AI relevant context can make the resulting analysis easier to interpret.
Ask for the Evidence
When an AI system gives you an important conclusion, ask:
- Which data supports this conclusion?
- What calculations were used?
- Which rows or metrics contributed to the result?
- Are there alternative explanations?
- Can you show the calculation?
This is particularly important for financial, scientific, operational, or business-critical analysis.
Verify Important Conclusions
AI can make analytical mistakes.
Before acting on an important result, verify the underlying numbers and methodology.
For high-stakes decisions, AI should be treated as an analytical assistant rather than the final authority.
Common Mistakes When Using AI for Data Analysis
1. Uploading Unclean Data
AI cannot reliably compensate for every data-quality problem.
2. Asking Vague Questions
Broad prompts often produce generic summaries rather than useful analysis.
3. Confusing Correlation with Causation
If two variables move together, that does not automatically prove that one caused the other.
4. Accepting AI Conclusions Without Verification
A confident explanation can still be wrong.
5. Ignoring Data Privacy
Before uploading confidential information, review the provider’s data handling, retention, security, and training policies.
6. Choosing a Tool Based Only on AI Features
A tool with impressive AI capabilities may still be a poor fit if it lacks the connectors, governance, visualization, or collaboration features you actually need.
Advantages and Disadvantages of AI Data Analysis Tools
Advantages
- Faster exploratory analysis
- Natural-language interaction
- Automated charts and summaries
- Reduced repetitive work
- Easier access to advanced analytical techniques
- Faster report preparation
- Useful assistance for non-technical users
- Support for data cleaning and transformation
Disadvantages
- AI-generated results can contain errors
- Advanced platforms can be expensive
- Large datasets may require higher-tier plans
- Some workflows still require technical expertise
- Data privacy must be considered carefully
- AI does not automatically understand business context
Frequently Asked Questions
What are AI data analysis tools?
AI data analysis tools are software applications that use artificial intelligence to help users inspect, transform, visualize, summarize, and interpret data.
Depending on the product, they may work with spreadsheets, databases, dashboards, statistical models, or connected business data.
What is the best AI data analysis tool in 2026?
There isn’t one universal winner.
Microsoft Power BI Copilot is a strong choice for business intelligence, Tableau AI for visualization and governed metrics, ChatGPT for conversational file analysis, Julius AI for advanced analytical workflows, and Looker Studio for accessible dashboards and reporting.
Can AI analyze Excel files?
Yes. Several modern AI tools can work with Excel files.
ChatGPT officially supports spreadsheet formats including XLSX and CSV for data analysis, while Julius also supports spreadsheet-based workflows.
The exact limits depend on the platform, model, account, file size, and subscription.
Can AI perform statistical analysis?
Yes. Some AI data analysis platforms can assist with statistical analysis, regression, forecasting, and other analytical workflows.
Julius, for example, specifically documents statistical analysis, regression, forecasting, and code-backed workflows.
However, users should still understand the assumptions behind a statistical method before using its results for important decisions.
Is AI data analysis accurate?
AI can be extremely useful for exploratory analysis, but it should not automatically be treated as error-free.
Accuracy depends on factors such as:
- Data quality
- Data structure
- The analytical method
- The question being asked
- The AI system
- The complexity of the task
Important conclusions should be independently checked.
Is Looker Studio an AI data analysis tool?
Looker Studio is better described as a business reporting and visualization platform than as a standalone AI data analyst.
Its major strengths are customizable reports, dashboards, visualization, and access to a large ecosystem of data sources.
That distinction is important when comparing it with tools such as ChatGPT or Julius.
Which AI data analysis tool is best for beginners?
For simple spreadsheet questions, a conversational tool such as ChatGPT can be easier to start with because users can upload supported files and ask questions in natural language.
For organizations building recurring dashboards, however, a BI platform may be the better long-term choice.
Final Verdict
The best AI data analysis tool depends less on the number of AI features and more on the type of work you need to perform.
Microsoft Power BI Copilot is the strongest fit for organizations that need AI-assisted business intelligence, reporting, and dashboards.
Tableau AI is an excellent choice for teams that prioritize advanced visualization, metrics, and interactive analytics.
ChatGPT is particularly convenient for individuals who want to upload spreadsheets and explore data through natural-language questions.
Julius AI stands out for users who need deeper statistical analysis, visualization, and code-backed analytical workflows.
Google Looker Studio remains a practical choice for marketers and businesses that need shareable dashboards and reporting without adopting a full enterprise BI platform.
The right choice is ultimately the one that fits your data sources, technical skill level, budget, privacy requirements, and reporting workflow.
Before paying for a subscription, try the platform with a representative dataset and evaluate not only the AI’s answers, but also how easily you can verify those answers and turn them into useful decisions.
Editorial Note
Last reviewed: September 2026
Pricing, product capabilities, AI models, integrations, and plan limits can change. This article focuses on the capabilities and positioning documented by the providers and is intended as a practical comparison, not a guarantee of analytical accuracy or product performance.
Related Articles
Continue exploring the best AI business tools:


One Comment